
NHL Player Ratings Explained
Motivation
Hockey stats have come a long way since the days of Plus-Minus and PIMs. A plethora of sophisticated evaluative metrics now exist for skaters and goaltenders alike, including Game Score and WAR. These new-age stats each individually represent vast improvements over mainstream norms, but even they are prone to blind spots. Inevitably, metrics developed by different people using different methods will each have their own unique strengths and weaknesses.
We believe this diversity should be celebrated. Moreover, we see a tremendous opportunity for combination or “stacking” of these metrics. This principle is central to our Player Ratings.
“Stacking is most effective when the base models are significantly different.”
Method
For more reasons than one, combining player metrics into a singular rating is not straightforward. Namely, we encounter the following hurdles:
- What “representation” of each statistic should be used?
- How can we combine metrics that may not resemble one another?
- What relative importance should be given to each metric?
The first challenge can be demonstrated using Game Score as an example. Consider a player having appeared in 200 or more games over the span of 3 seasons. If you were asked to summarize this player’s performance to date using Game Score, what might your approach be? One option is to simply divide the player’s sum Game Score by 200 to obtain an average Game Score per Game (GS/GP). In doing so, we assign the same importance to games played 3 seasons ago as games played in the current or last season, which may not be optimal. Additionally, this approach may unfairly flatter players who are given more minutes.
This is what we mean by using the best “representation” of a given statistic. Our approach to solving this problem was to develop a method of testing the “usefulness” of a particular statistic, then applying this procedure to a large array of different versions – effectively turning this into an optimization problem. Usefulness here was defined as follows: if measures of team roster strength (separated by player position) were taken using a given statistic, how successfully could we predict game outcomes using them in addition to basic predictors like home ice advantage and fatigue? This framework was used to select representations of each player metric. For Game Score, the optimal version was found to be a recency-weighted average of GS/GP over the previous 120 games.
Another important consideration is how to curb results obtained in small samples such that they do not put forth an unfair representation of a player’s ability. Our solution is to regress a player’s metrics towards a known average in cases where they have not yet exceeded an arbitrary Games Played threshold. For a given parameter P and metric M, the mean value of M, mM is computed for all players whose cumulative games played are fewer than P. A regularized version of M, M’ is then calculated in cases where a player has played fewer games than P.
M’ = (GP * M + (P – GP) * mM)/P
In order to produce a single number from this set of components, we opted to use a linear combination:
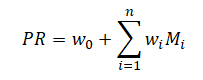
where Mi is the ith regularized metric and wi the corresponding weight. It is clear that this framework becomes totally dependent on the values given to the yet undefined weights w.
Thankfully, we have already defined a method for expressing the “usefulness” of a metric. This method can be recycled in order to optimize the weights such that they produce the best-performing Player Rating.
Results
We think we’ve produced the best single-number representation of a player’s quality that currently exists publicly. Visit our Player Ratings page by clicking the button below and see what you think.